Rules
Part of Direct selling: a focused business guide for 2027
Direct selling benchmarks: the baseline numbers worth tracking
Direct selling benchmarks worth tracking cover retail sales, autoship retention, attrition, and income disclosure, measured against a stated period and population.
What to take away
- Direct selling benchmarks worth tracking are baseline numbers: retail sales per active distributor, autoship retention, attrition, and income distribution.
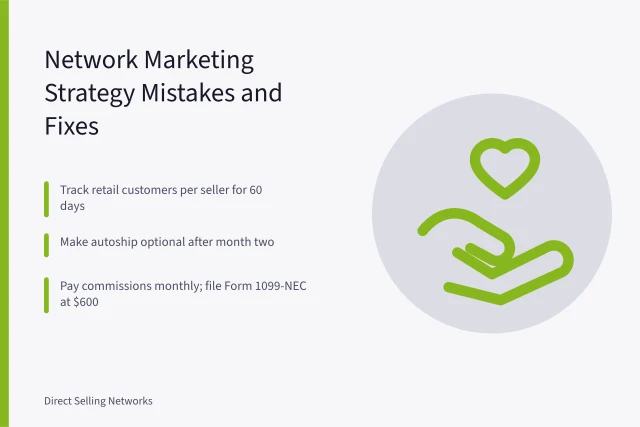
- Track retail customer sales separately from recruitment volume; only the first proves demand.
- Report autoship retention at 90 and 180 days, not at signup.
- Publish the percentage of distributors who earn nothing after expenses.
- Compare your attrition and refund rates against your own prior quarters before any external figure.
- Keep every benchmark tied to a named period, population, and currency.
Direct selling benchmarks only mean something when the unit is a customer transaction, not a signup. A plan that pays on recruitment can look healthy for two quarters while retail demand falls. The numbers below are the ones a distributor or a small company can pull from its own records.
Retail sales per active distributor
This is total customer sales, excluding distributor self-purchases and autoship orders placed only to qualify for commission, divided by the number of distributors who placed at least one retail sale in the period. The direct selling model depends on this figure staying positive after refunds.
Retail sales per active distributor
- $150-$400monthly consumables
- $80-$250monthly one-time goods
- 2%-8%refunds consumables
- 5%-15%refunds apparel and beauty
A workable baseline in most markets as of 2026: $150 to $400 in monthly retail sales per active distributor for consumable goods such as skincare, supplements, and household products. One-time-purchase plans, such as kitchen tools or jewelry, often run $80 to $250 per month.
Refund rates typically take 2% to 8% of retail sales for consumables and 5% to 15% for apparel and beauty.
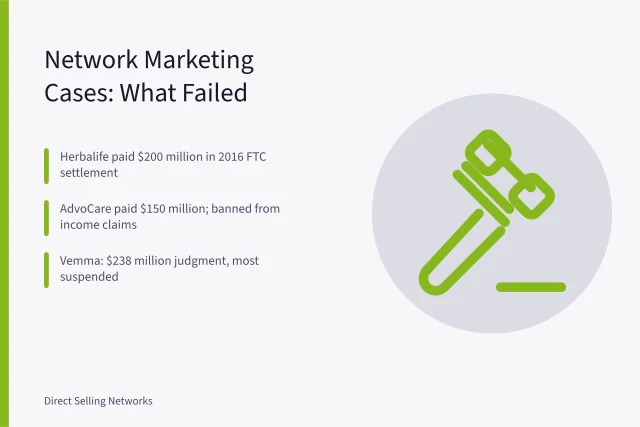
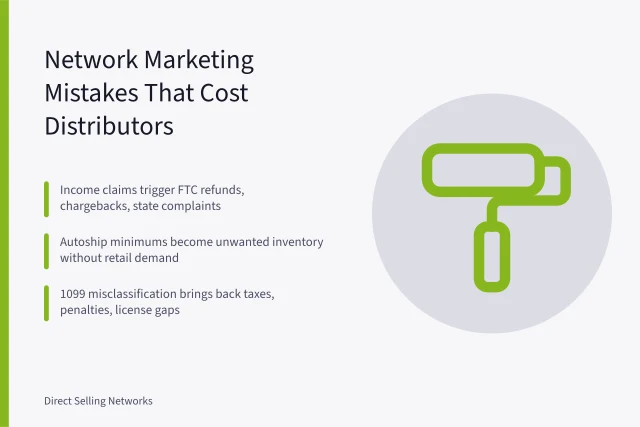
If the number falls while recruitment rises, the business is loading inventory onto sellers rather than selling to customers. That pattern is the failure mode state attorneys general and the FTC look for when they examine a plan.
Autoship retention at 90 and 180 days
Measure the share of customers still receiving autoship 90 days after their first order, then again at 180. A high 30-day rate with a steep drop by 180 usually means the first order was a promotion, not a habit.
Autoship retention by cohort
- Consumables 90 days55%-70%
- Consumables 180 days40%-55%
- One-time 90 days30%-45%
- One-time 180 days20%-35%
Typical ranges in most markets as of 2026: 55% to 70% of customers remain on autoship at 90 days for consumables, and 40% to 55% at 180 days. One-time-purchase plans show 30% to 45% at 90 days and 20% to 35% at 180 days. A 30-day rate above 80% often comes from a starter kit or discount.
Track this by cohort, not as a company-wide average. A blended number hides the cohort that is churning.
Attrition and the income distribution
Two figures belong on the same page. The first is the percentage of distributors active 12 months after enrollment. The second is the share whose commissions exceeded their own purchases and fees.
Attrition and income reality
60%-80% | 12-month attrition
$0-$500 | median annual commission
70%-90% | earn nothing after costs
Typical 12-month attrition in most direct selling plans runs 60% to 80%. Published income disclosures from large sellers often show a median annual commission between $0 and $500, and 70% to 90% of distributors earn nothing after subtracting purchases and fees. Companies including Herbalife, Avon, and USANA publish annual income disclosure statements.
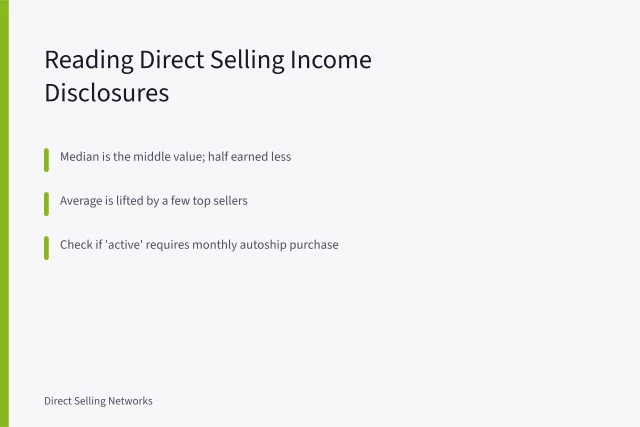
The FTC's guidance on income claims and the DSA's income disclosure standards both require that earnings statements not overstate typical results. State the period and whether the figure is mean or median; a mean pulled up by a few top earners tells a new seller nothing.
| Benchmark | Typical baseline range (most markets, 2026) | What to record | Acceptance test |
|---|---|---|---|
| Retail sales per active distributor | $150-$400/month consumables; $80-$250/month one-time goods | Customer sales only, refunds deducted | Positive after refunds |
| Autoship retention | 55%-70% consumables at 90 days; 40%-55% at 180 days | Cohort at 90 and 180 days | Flat or rising by cohort |
| 12-month attrition | 60%-80% | Share still active one year after enrollment | Compared to prior quarters |
| Income distribution | Median annual commission $0-$500; 70%-90% earn nothing after expenses | Mean and median, period stated | Median disclosed alongside mean |
| Cost per productive recruit | $80-$300 | Lead spend, samples, and onboarding divided by recruits reaching first retail sale | Payback shorter than average active months |
Cost per recruit and payback
Divide total lead spend, samples, and onboarding cost by the number of recruits who reach their first retail sale. That is cost per productive recruit, and it is the only version worth tracking.
Typical cost per productive recruit in most markets as of 2026 runs $80 to $300. Lead costs often fall between $5 and $25 per lead, and 1% to 5% of leads become recruits who make a retail sale.
If a recruit costs $200 and the average distributor stays active 8 months, the plan needs $25 per month in gross margin to break even. If the arithmetic gives a payback longer than the average distributor stays active, the recruitment spend is not recovering. Substitute your own figures for lead cost, conversion rate, and average months active.
Where outside references fit
The NIST AI RMF Playbook lists voluntary actions for teams using AI in a workflow. It is not a certification and not a ranking of companies, so it does not tell you whether your retention figure is good.
The GAO data reliability guide treats data quality as a question of intended use. It supports documenting how a number was built, not claiming it is certified.
The GOV.UK technology selection guidance covers ownership cost and data control when choosing a CRM or autoship platform. Those questions apply to a distributor software purchase.
The NIST experimental design selection guidance separates descriptive reporting from a controlled test. Use it when you want to know whether a change caused a retention shift or merely coincided with one.
Common questions
What is the single most useful direct selling benchmark?
Retail sales per active distributor, with self-purchases removed. A workable baseline in most markets is $150 to $400 per month for consumables; below $80 per month, the plan usually pays for signups rather than demand.
How often should these numbers be reviewed?
Quarterly, by cohort, with the period and currency stated. Use 90-day and 180-day autoship windows and a rolling 12-month attrition figure. Annual reviews hide the quarter where retention broke.
What should a distributor do if recruitment outpaces retail sales?
Stop recruiting spend and audit the last two cohorts. If more than half of recruits never made a retail sale, the plan is paying for signups, and that is the pattern regulators examine.
Can I use an industry average instead of my own numbers?
Only as a comparison, never as a target. Typical industry ranges: 55% to 70% 90-day autoship retention for consumables, 40% to 55% at 180 days, and 60% to 80% 12-month attrition. Industry averages blend company sizes and compensation plans, so your own prior quarters are the more honest baseline.